When I first used git log with the graph option it looked really strange. As I kept on looking at it and comparing it with the nice visual representations of it in git clients like SourceTree, then it finally made sense to me. I would like to shortcut that process for anyone reading this and show you how useful the graph view is in the terminal.
Git log (with graph option)
The git log command gives you a hundred and one ways to view your commit logs, but I find the git log with the graph option is the most useful. There's two ways to view the commit logs in a nice graph format. One is easy and requires no configuration, the other one requires configuration, but is slightly prettier. In the end, I found it's best to configure it to avoid all that pesky typing.
No configuration
I'll continue at the master branch from my tutorial on git reflog. I'm going to run the following command to display the graph of my commit logs.
$ git log --all --decorate --oneline --graph

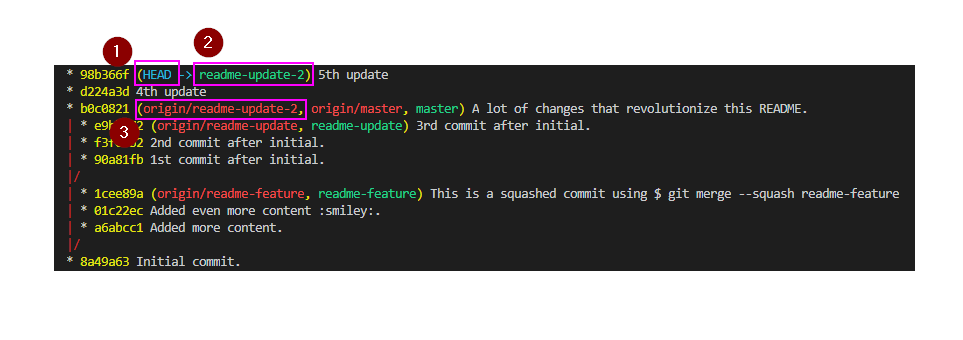
Now, I can see this exciting commit graph. The next screenshot focuses on the readme-update-2 branch. With the following explanation:
- In blue is the where we currently are, denoted by HEAD ->, which is pointing at the branch readme-update-2.
- In green is where the local version of the branch is at. It's currently two commits ahead of origin/readme-update-2.
- In red is where the remote branch is at. I see that origin/readme-update-2 is two commits behind the local branch readme-update-2

When I run the following command:
$ git log --graph --abbrev-commit --decorate --format=format:'%C(bold blue)%h%C(reset) - %C(bold green)(%ar)%C(reset) %C(white)%s%C(reset) %C(dim white)- %an%C(reset)%C(bold yellow)%d%C(reset)' --all
I get a slightly prettier graph. By slightly prettier, I mean it has more information. I get the following additional information:
- How long ago that commit was.
- The author of the commit.

The more I look at it though, I'm starting to lean towards the default git log --all --decorate --oneline --graph. The colours in that one allow you to easily distinguish between local and remote, as well as seeing where the head is at.
Now I'll push my local commits to remote for my readme-update-2 branch and I'll see the effect that has on the graph.

I can see that my remote readme-update-2 branch is now caught up to my local readme-update-2 branch. In the prettier version we have:

After looking at this, I prefer the green and red that differentiates the local and remote branches.
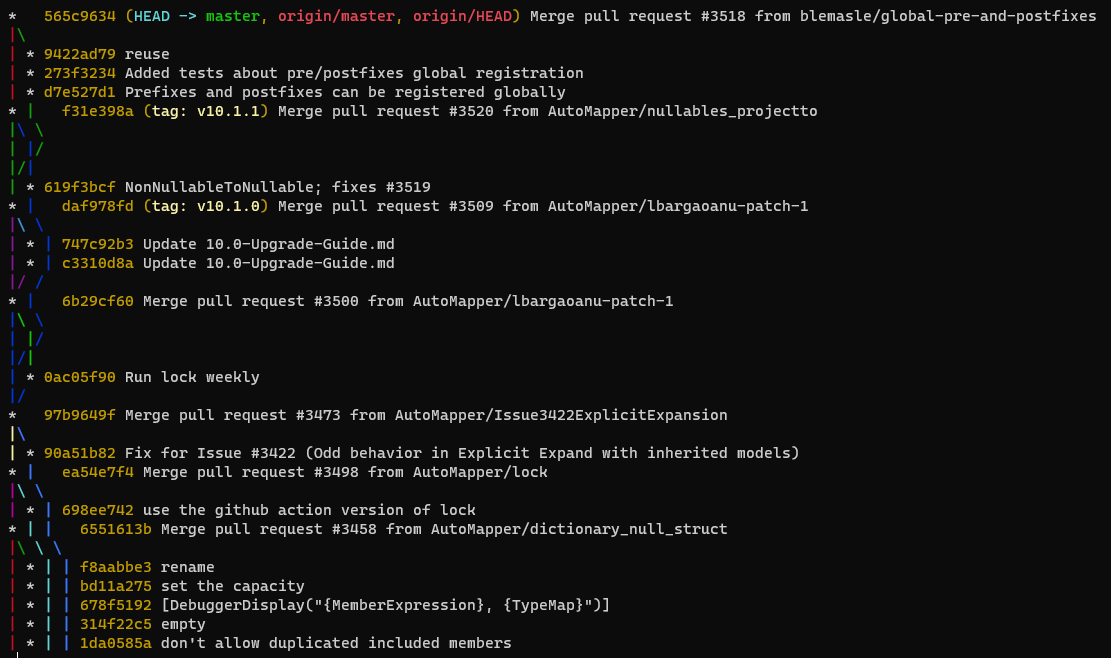
This is a cute example of the git log graph, but I'd like to see what it looks like for another project with multiple branches and more commits. I'm going to show you what the AutoMapper repo looks like.

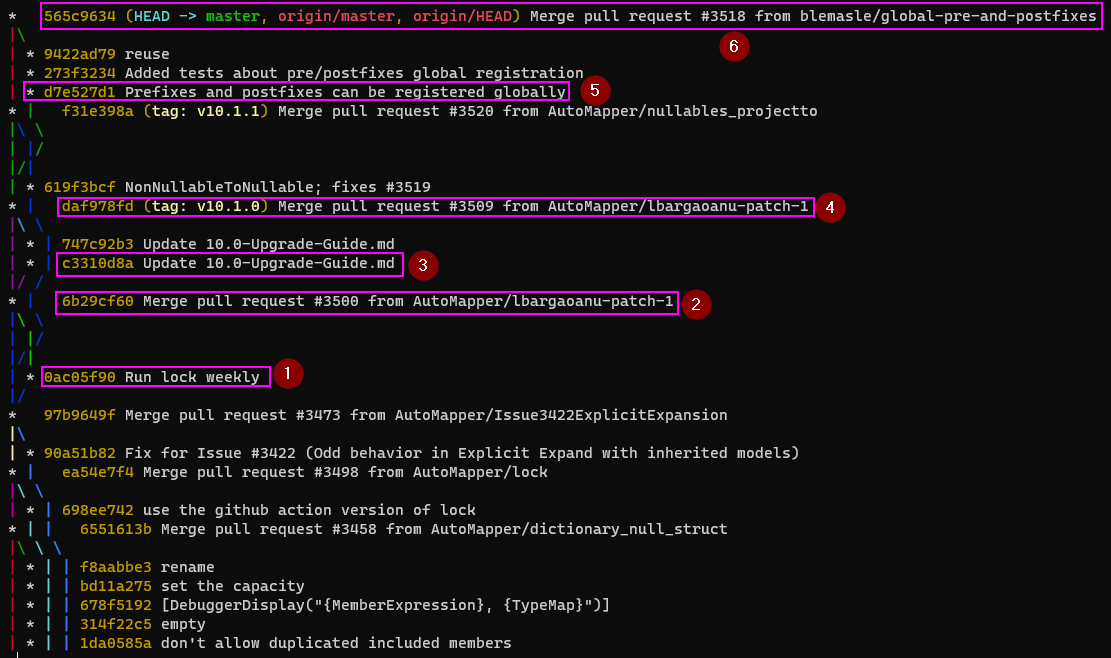
There's a little bit going on here, but nothing crazy. I want to point out some things though.

- I can see where someone branched off and made a single commit.
- They create a pull request to have the changes merged back into master.
- This is the start of another branch. They make another commit that looks like a duplicate. Not sure what happened there.
- They create a pull request to have the changes merged back into master.
- Another branch is created, but they don't commit changes right away. You can see that commit f31e398a merges in changes from another branch, which is why the commits appear afterwards.
- Finally, a pull request is created to have the changes merged back into master.
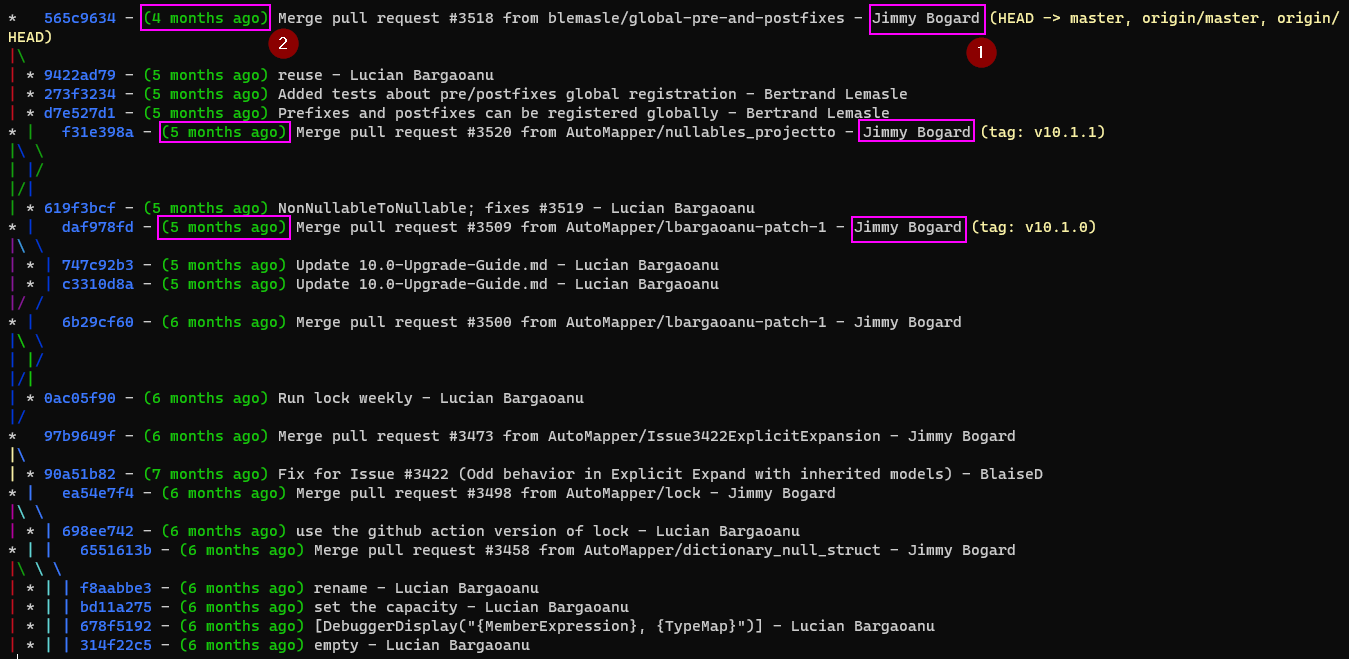
With the slightly prettier way of viewing the graph we can get some more information.

- The author of the commit. Jimmy Bogard maintains this repository, so I can see that he is the only one approving and merging pull requests into master.
- How long ago the commit was made.
Hopefully now, you can type in git log --all --decorate --oneline --graph and make sense of it in the console.
Configuring git log with the graph option
I don't want to type in git log with all the options to get the log graph, so I can just create the following alias in the terminal this way:
$ git config --global alias.lg1 'log --all --decorate --oneline --graph'
Now I can just type to the following to get my graph:
$ git lg1
I can do the same for the graph with the commit author and relative dates by copying and pasting the following text into my console:
$ git config --global alias.lg2 'log --graph --abbrev-commit --decorate --format=format:''%C(bold blue)%h%C(reset) - %C(bold green)(%ar)%C(reset) %C(white)%s%C(reset) %C(dim white)- %an%C(reset)%C(bold yellow)%d%C(reset)'' --all'
Now I can just type the following in the console to get my graph with commit authors and relative dates:
$ git lg2
That's pretty much it. Being able to read this text graph can help us easily read a graph that is more graphical in any Git client. The bonus is that you may not need to use a Git client for that sole purpose if you can easily read it in the console.